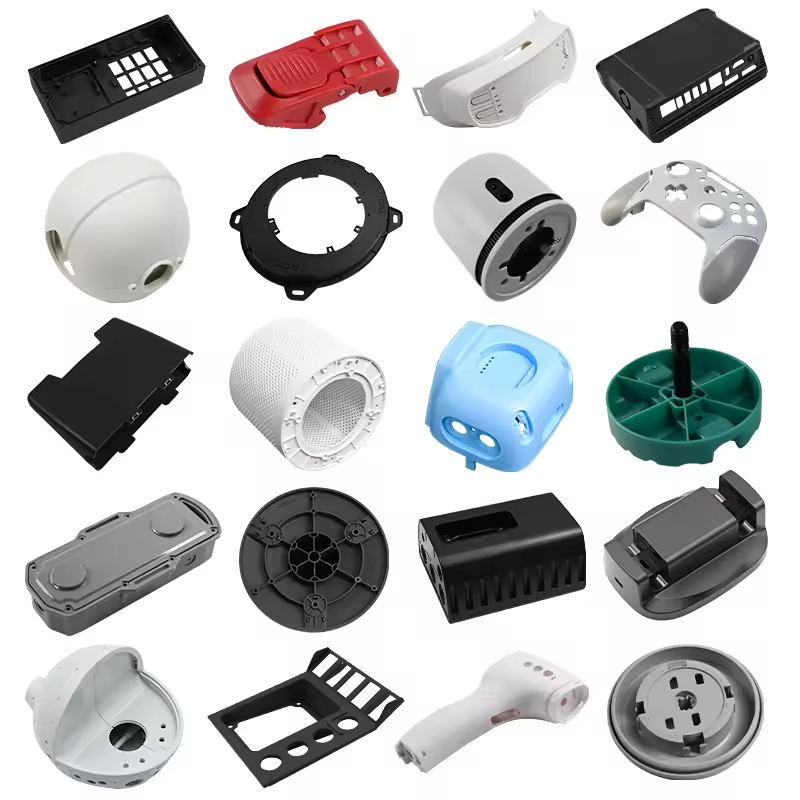

Why Injection Molding Part Cost Matters
Injection molding is one of the most cost-effective manufacturing processes for high-volume plastic parts—but only when optimized correctly. Without deliberate cost engineering, tooling amortization, material waste, and cycle time inefficiencies can quietly erode margins by 30% or more. The good news: most of these costs are preventable. By applying proven strategies across part design, molding process, and supply chain, manufacturers routinely achieve 20–50% unit cost reductions without sacrificing quality. This guide walks through 15 actionable strategies, each rated by potential savings and implementation difficulty.
1. Part Design Strategies
Part geometry is where the largest and most permanent cost decisions are made. Once steel is cut, changing a wall thickness or gate location becomes expensive. Design-stage optimization delivers the highest ROI of any cost-reduction lever.
1.1 Uniform Wall Thickness
Potential Savings: 10–15% | Difficulty: Medium
Non-uniform walls create uneven cooling, internal stress, warpage, and sink marks—all of which extend cycle time and increase scrap. Designing for consistent wall thickness (typically 40–60% of nominal for ribs and bosses) shortens cooling time, reduces defects, and eliminates costly post-molding straightening. Run mold-filling simulation early to identify thickness transitions and optimize gate placement.
1.2 Reduce or Eliminate Undercuts
Potential Savings: 15–25% | Difficulty: Medium to High
Undercuts require side-actions, lifters, or collapsible cores—each adding tooling complexity, cost, and cycle time. Redesign parts to eliminate undercuts wherever possible. For features that absolutely require them, use pass-through coring, sliding shutoffs, or snap-fit redesigns to avoid mechanical slides.
1.3 Self-Mating or Family Molds
Potential Savings: 20–40% | Difficulty: High
Designing left-hand and right-hand parts to mate in a single mold, or combining multiple small parts into a family mold, splits tooling cost across more cavities and reduces press utilization. This is especially powerful for symmetrical products like enclosures, handles, and brackets.
1.4 Eliminate Secondary Operations
Potential Savings: 25–50% | Difficulty: Medium
Secondary operations—drilling, tapping, painting, adhesive bonding, insert installation—add labor, equipment, and quality-inspection cost. Mold in threads, textures, snap-fits, and living hinges directly. Replace adhesive assemblies with overmolding or two-shot molding where volumes justify the tooling investment.
1.5 Material Substitution
Potential Savings: 10–30% | Difficulty: Low to Medium
Evaluate whether a less expensive resin can meet the same functional requirements. Switching from polycarbonate to a PC/ABS blend, or from nylon 66 to a filled polypropylene, often preserves mechanical performance at a significantly lower material cost. Always validate with physical testing before production cutover.

2. Process Optimization Strategies
Once the mold is built, process parameters and production setup determine the ongoing per-part cost. These five strategies target the press, tooling, and automation layer.
2.1 Increase Cavitation
Potential Savings: 30–60% | Difficulty: Medium
Moving from a single-cavity to a multi-cavity mold distributes tooling cost over more parts per cycle. A 4-cavity mold does not cost 4x a single-cavity mold—typically 2.5–3x—while quadrupling output. The breakeven point depends on annual volume, but for parts above 50,000 units per year, 4+ cavities almost always pay back within months.
2.2 Reduce Cycle Time with Conformal Cooling
Potential Savings: 15–35% | Difficulty: High
Conformal cooling channels, produced via additive manufacturing (3D-printed tooling inserts), follow the part contour precisely rather than using traditional straight-drilled channels. This cuts cooling time—typically 60–70% of total cycle—by 20–40%, directly reducing per-part cost. Best applied to complex geometries and high-volume programs.
2.3 Optimize Gate Type and Location
Potential Savings: 5–15% | Difficulty: Low
Gate design affects fill pressure, knit-line placement, and packing. Switching from a cold sprue to a hot runner, or from edge gates to a tunnel gate, can reduce material waste and shorten cycle time. Valve-gated hot runners add control but eliminate gate vestige trimming entirely.
2.4 Reduce Scrap and Regrind
Potential Savings: 5–20% | Difficulty: Low to Medium
Scrap reduction starts with process stability: consistent temperatures, controlled shot size, and predictive maintenance on barrel heaters and thermocouples. Where regrind is permitted, blend up to 20–30% with virgin material to recover material cost, but validate mechanical property degradation with your resin supplier.
2.5 Lights-Out Automation
Potential Savings: 15–40% | Difficulty: High
Robotic part removal, automated degating, in-line inspection, and auto-packaging eliminate direct labor and reduce variability. While the capital investment is significant, for programs exceeding 250,000 units annually, automation typically achieves payback within 12–18 months through labor savings and reduced defect rates alone.

3. Supply Chain Strategies
Supply chain decisions often deliver the fastest payback among all cost levers because they require no tooling changes and minimal process disruption.
3.1 Consolidate Suppliers
Potential Savings: 5–15% | Difficulty: Low
Spreading production across multiple molders fragments volume, weakens negotiating leverage, and adds management overhead. Consolidating with 1–2 strategic partners unlocks volume discounts, shared tooling strategies, and streamlined quality management. Run a supplier scorecard annually to identify consolidation candidates.
3.2 Bulk Material Purchasing
Potential Savings: 10–25% | Difficulty: Low
Resin pricing is volume-sensitive. Committing to truckload quantities, blanket purchase orders, or annual contracts typically yields 10–25% lower per-kilogram pricing compared to spot buying. Coordinate with your molder to forecast annual resin consumption and negotiate directly with material suppliers.
3.3 Regional Manufacturing
Potential Savings: 10–30% | Difficulty: Medium
Nearshoring or onshoring production reduces freight cost, inventory carrying cost, import duties, and lead time. A part molded in Mexico for North American consumption, or in Eastern Europe for Western European markets, often delivers total landed cost 10–30% below an equivalent Asian-sourced part when all logistics factors are included.
3.4 Mold Ownership Strategy
Potential Savings: 20–40% | Difficulty: High
Owning your molds outright—rather than amortizing them into the part price—gives you freedom to move production between molders and eliminates the ongoing tooling premium typically embedded in molder-owned-mold quotes. The upfront investment is higher, but for programs exceeding 3 years, mold ownership is almost always the lower total-cost option.
3.5 Long-Term Contracts
Potential Savings: 10–20% | Difficulty: Low
Molders price risk into short-run programs. A 3–5 year supply agreement with guaranteed minimum volumes shifts the risk calculus and unlocks both better pricing and priority scheduling. Include annual cost-reduction targets, raw material passthrough clauses, and productivity-sharing provisions to keep incentives aligned over time.

Strategy Comparison at a Glance
| Strategy | Potential Savings | Difficulty | Category |
|---|---|---|---|
| Uniform Wall Thickness | 10–15% | Medium | Design |
| Reduce Undercuts | 15–25% | Medium–High | Design |
| Self-Mating Parts | 20–40% | High | Design |
| Eliminate Secondary Ops | 25–50% | Medium | Design |
| Material Substitution | 10–30% | Low–Medium | Design |
| Increase Cavitation | 30–60% | Medium | Process |
| Conformal Cooling | 15–35% | High | Process |
| Optimize Gate | 5–15% | Low | Process |
| Reduce Scrap | 5–20% | Low–Medium | Process |
| Automation | 15–40% | High | Process |
| Consolidate Suppliers | 5–15% | Low | Supply Chain |
| Bulk Purchasing | 10–25% | Low | Supply Chain |
| Regional Manufacturing | 10–30% | Medium | Supply Chain |
| Mold Ownership | 20–40% | High | Supply Chain |
| Long-Term Contracts | 10–20% | Low | Supply Chain |
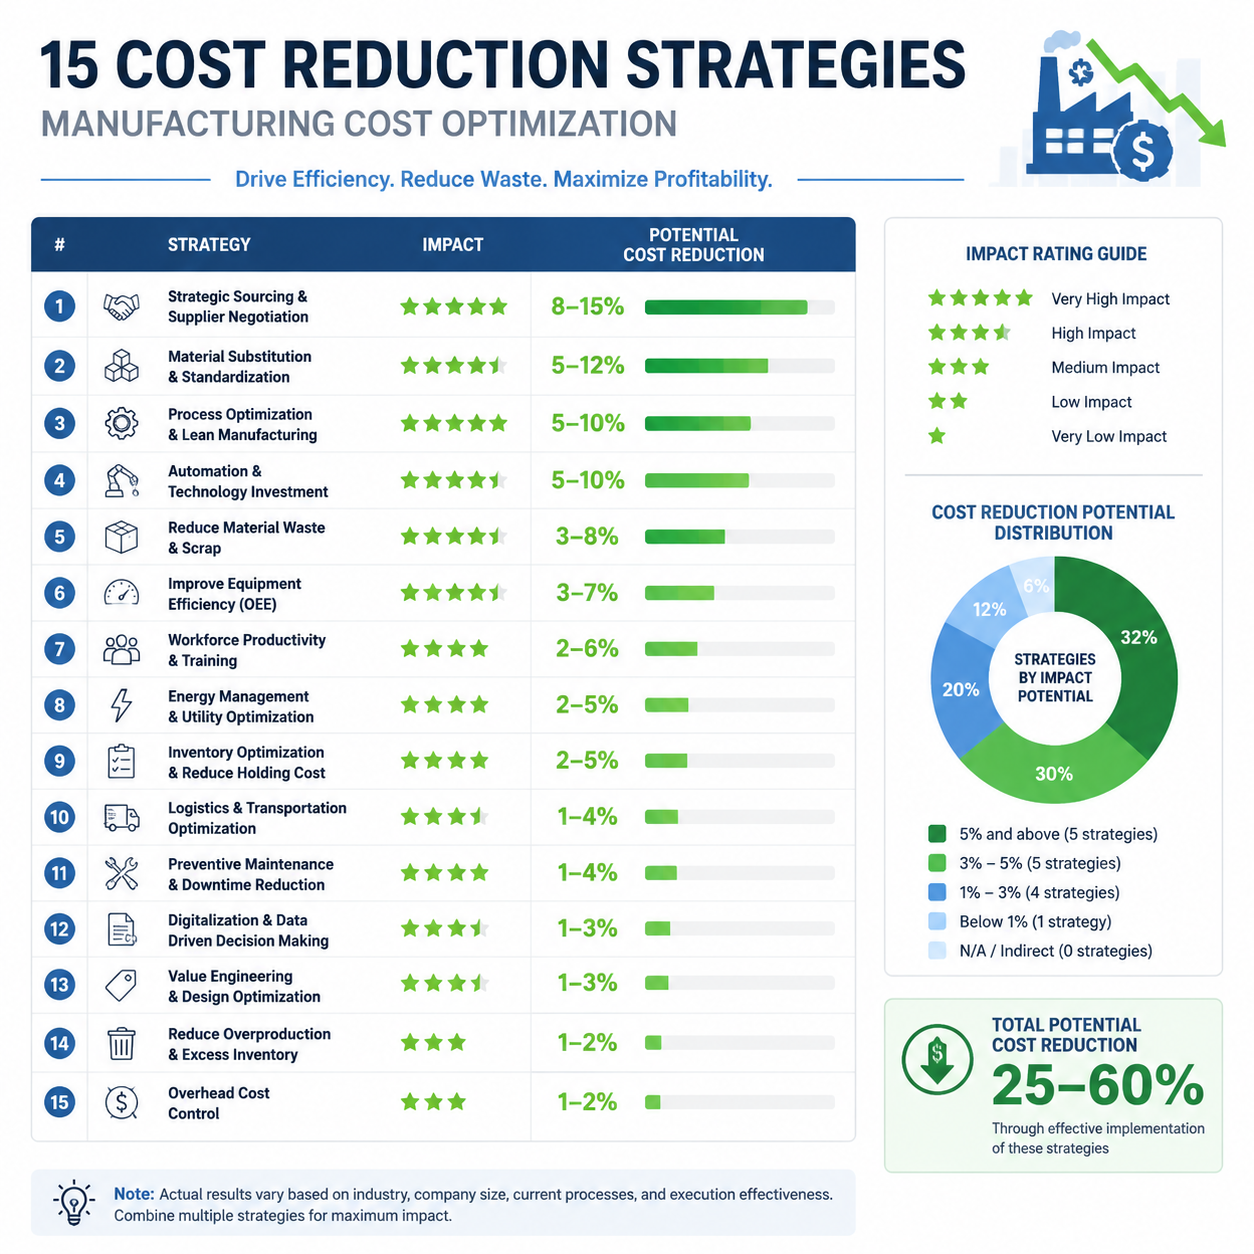
Frequently Asked Questions
What are typical savings from a design-for-manufacturing (DFM) analysis on an existing injection molded part?
An effective DFM analysis on an existing production part typically identifies 10–30% in unit cost reduction opportunities. The largest savings usually come from wall thickness optimization, undercut elimination, and material substitution recommendations. In many cases, the DFM analysis pays for itself within the first production batch. The key is engaging the mold design team early—ideally during the prototyping phase—when the largest number of changes can be made at the lowest cost.
At what annual volume does a multi-cavity mold breakeven versus a single-cavity mold?
The breakeven point depends on part size, material, and tooling complexity, but a reasonable rule of thumb is 10,000–25,000 parts per year for a 2-cavity mold and 50,000–100,000 per year for a 4-cavity or higher configuration. Multi-cavity tooling costs roughly 1.5–1.7x per additional cavity (not linear), so the incremental investment pays back quickly when annual volumes justify it. Run a total-cost model that includes press time, labor, and maintenance to find your exact breakeven.
How much regrind can I safely use without compromising part quality?
Most commodity and engineering thermoplastics tolerate 20–30% regrind blended with virgin material without significant degradation, provided the regrind is clean, dry, and generated from the same resin family. For critical applications—structural, medical, or tight-tolerance parts—limit regrind to 10–15% and validate mechanical properties (tensile strength, impact resistance, melt flow index) with your material supplier. Never use regrind that has been exposed to moisture or mixed with incompatible resins.
When should I consider moving a mold to a different supplier to reduce cost?
Moving a mold makes economic sense when the annual cost savings exceed the transfer cost (freight, requalification, and first-article inspection) within 12 months. Common triggers include: your current molder cannot match a competitor’s quoted part price by 15% or more, labor rates in a lower-cost region create a sustained advantage, or your volume has grown enough to justify a higher-automation facility. Before moving, ensure you have clear mold ownership documentation, complete 2D/3D mold drawings, and a requalification protocol agreed with the receiving molder.